Decline in Amphibian Population in the United States
Decline in Amphibian Population in the United States Lyrics
Abstract
Though a third of amphibian species worldwide are thought to be imperiled, existing assessments simply categorize extinction risk, providing little information on the rate of population losses.
We conducted the first analysis of the rate of change in the probability that amphibians occupy ponds and other comparable habitat features across the United States. We found that overall occupancy by amphibians declined 3.7% annually from 2002 to 2011.
Species that are Red-listed by the International Union for Conservation of Nature (IUCN) declined an average of 11.6% annually. All subsets of data examined had a declining trend including species in the IUCN Least Concern category. This analysis suggests that amphibian declines may be more widespread and severe than previously realized.
Discussion
Statistically unbiased estimates of the rate of change in amphibian patch occupancy are necessary to understand the scale and severity of amphibian losses. They are particularly useful for species considered to be of Least Concern whose trends may be more subtle than for species determined to be imperiled at some level by the IUCN. An average loss of 2.7% of occupied sites each year for the species of Least Concern monitored by ARMI (Amphibian Research and Monitoring Initiative) is alarming given that these species are thought to be relatively unaffected by global amphibian declines. This finding suggests that the IUCN threat status has been underestimated for some of these species. This is not a criticism of the IUCN effort, but illustrates the added value of statistically robust monitoring data to inform managers and policy makers.
Sites sampled by ARMI were designed to be roughly equivalent to populations but the relationship between sites and populations is variable and not precisely known. We characterize our rate estimates as addressing change in the occupancy of habitat patches but in one study area the scale was small watersheds with an average of 8.6 ponds in each. Trends in occupancy should not be equated with trends in density. Occupancy studies necessarily include occupied and unoccupied patches. Therefore, trends in occupancy reflect a process involving both local extinctions at occupied patches and colonization of unoccupied patches.
Primary hypotheses to explain global amphibian declines are land use change, disease, global climate change, and interactions of these factors with each other or with other stressors like contaminants or habitat degradation. Anthropogenic habitat loss is rare at ARMI study areas. The fungal pathogen associated with chytridiomycosis is found throughout the US and is common in most, but not all ARMI study areas where tested. Presence of the fungus resulted in reduced survival of adult amphibians in one study ,but it is difficult to establish a direct link to declines in occupancy. Major die offs of amphibians were not observed in any of the studies analyzed here. The role of climate in changes in occupancy is difficult to evaluate for relatively short time series and we expect that patterns in occupancy caused by climate change will take years to become evident. The decade during which ARMI collected data experienced severe, but not unprecedented, drought . Because most of the amphibians monitored rely on the presence of water for reproduction and development, precipitation patterns are an obvious hypothesis to explain changes in occupancy. The relationship between occupancy trends and any potential driver is likely to vary across regions, habitats, and species necessitating careful specification of mechanisms prior to analysis of drivers.
Because the species and areas that ARMI monitors are not random, the declines we documented cannot be extrapolated directly to the rest of the U.S. or worldwide. This caveat also applies to all existing compilations of trends in amphibian abundance. However, it is useful to consider how our trend estimates may compare to the larger population of species and areas in the U.S, which in most cases have larger distributions than our monitoring areas (armi.usgs.gov/national_amphibian_atlas.php).The species and areas monitored by ARMI were generally selected to evaluate the status and trends of amphibians on federally-managed lands at the scale of management units. Such lands are sometimes perceived as better protected than private lands. In many cases, monitoring areas were selected to target a specific imperiled species but, by design, other local species were also monitored. Hence, our analysis includes a broad range of species that span most IUCN categories of endangerment, but Least Concern species are overrepresented (86% compared to 63% nationally). Also, the first year of occupancy estimates was 2002, long after many severe declines are thought to have begun. These factors are evidence that our analysis may underestimate the actual rate of amphibian losses in the United States. However, we emphasize that the true direction and magnitude of sampling bias is unknown and the relatively short time period monitored may not be representative of longer trends. We also note that our estimates of trends are based on estimates of occupancy that each have associated error (see armi.usgs.gov for SEs). Nonetheless, the trends we found represent the only broad assessment of population losses for amphibians in the U.S.
There is more than one way to estimate trends in occupancy estimates. We used log-linear models to estimate occupancy in a given year as a proportion of the previous year's occupancy. A change from 0.5 to 0.25 and a change from 0.1 to 0.05 both represent a 50% decline though the latter might involve a change in the occupancy status of a small number of sites relative to the former. As a result, similar absolute changes in occupancy influence estimates of trend more for areas where occupancy is low than for areas where occupancy is high. An alternative approach is to use linear models that estimate absolute changes in occupancy. Both methods are valid, but their sensitivity to extreme occupancy estimates and the interpretation of their estimates differ. For example, both methods suggest declines in all subsets of data examined, but the distribution of trend estimates produced by log-linear models has a greater number of extreme negative estimates.
Conclusions
We provide a synthesis of a monitoring program that is unique in its national scope And use of statistically unbiased occupancy estimates.
Our trend estimates are consistent with other analyses showing that amphibians are declining And go further by suggesting that species for which there has been little conservation concern, Or assessment focus (e.g., common species) may also be declining.
While there was some variation across the U.S., the trend was consistently negative. Furthermore, declines are occurring on lands managed by federal agencies
With the greatest observed rate of decline on National Park Service lands
Where management policy prescribes protection of natural ecosystem processes.
Overall, the trends we documented suggest that amphibian declines may be more widespread And severe than previously thought.
Where management policy prescribes protection of natural ecosystem processes.
Overall, the trends we documented suggest that amphibian declines may be more widespread And severe than previously thought.
About
Genius Annotation
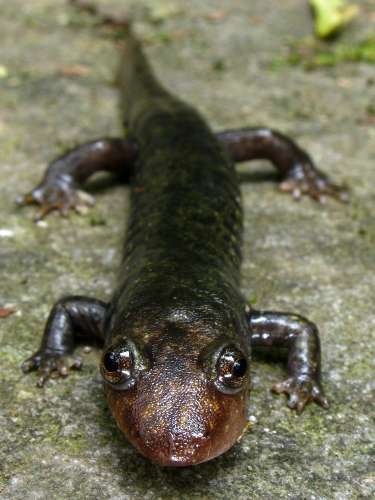
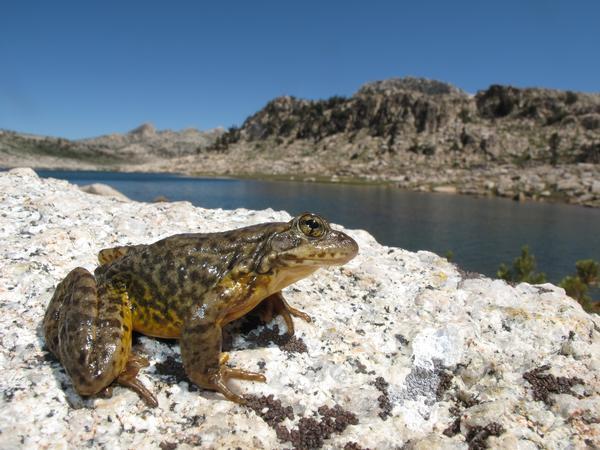
Amphibians – frogs, toads, salamanders (see below) showed a significant decline in population world wide; this study concentrates on the US, but its findings and conclusions are relevant to the world wide concerns.
This is a subset of the consequences of climate change, urban sprawl, chemical use in agriculture and other causes.
Newsgenius has previously put forward the report about the decline in the bee population.
The complete study including tables and figures as well as citations can be found here
Q&A
Find answers to frequently asked questions about the song and explore its deeper meaning
Comments